Super frustrating CPU 99 Occupancy HELP PLEASE

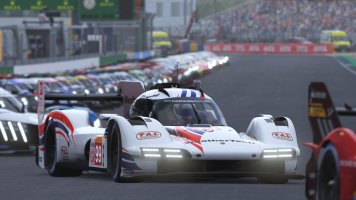
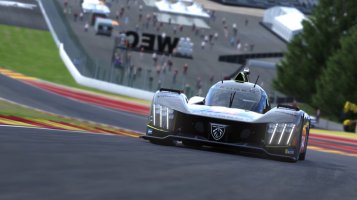
I have been experiencing an issue with AC, it started around the time I downloaded and installed CSP .1.75, but since then it happens with every csp build.
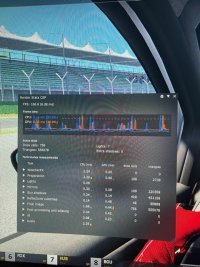
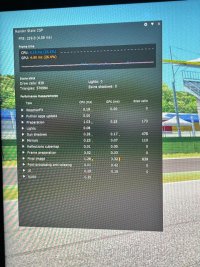
Problem is the CPU Occupancy 99% and stuttering (it kind of goes into slow motion, I dont know if stuttering is the right word).
I tried updating SOL 2,1, updating GPU controllers, verifying game integrity, and nothing works
My PC build has been the same siince the start of the year and it has run everything with no problem (A lot of AI, heavy mods, rainfx, etc) Content manager sometimes crashes and makes a report when starting a session, sometimes it does not.

Ive tried every fix that I can find (wheel ffb, face reflections down to 1, low graphics, etc )and havent seen a solution yet, any idea ?


MY PC BUILD

NVIDIA Geforce RTX 2060 SUPER (controller 466.27)
INTEL CORE I7-9700F
31.93 GB RAM


FIXED by using CPU PROCESS LASSO AND FORCING A MULTI-THREADED USE
 
Last edited:
Does it go away when you uncheck the "active" box in the "general patch settings" tab?
This disables csp completely with one click.

It's a good test to see if it's really csp or if it's something else
 
i was about to post this by myself,but i guess I'll just say it here:


i have the same problem but when i use higher settings it doesn't show up, yet i have a lower fps, then i turn the settings to the lowest, the fps improves, but the message keep showing up, and the game goes slow motion, i still don't know what caused this. if only the developers updated the game.....
This is easily explained but takes a lot of words:

You have a few game cpu threads that take time to be calculated (frame time).
At higher settings, the biggest of these threads takes by far the longest time to be completed for each frame.
You can't split these single threads so what normally happens is that your cpu is hanging in the "single thread limit", which in theory means that one cpu core is at the maximum and since you can't split the load, the other cpu cores can't help that one core.

Windows is shuffling the game threads across all cores all the time though to maximize efficiency. It happens a million times per second so Taskmanager etc will show a nicely spread load across all cores. But if you'd slow down time far enough, you would see one core hitting the maximum, then the next core hitting the maximum etc.

Now if you lower the settings, that one biggest game thread takes less time to be completed and therefore the fps go up.
In relative terms though, the other game threads now cause a higher load.

If Windows wouldn't shuffle the threads around across all cores, it would be like this:

High settings: for example 50 fps
Core 1 = 100%
Core 2 = 50%
Core 3 = 50%
Core 4 = 30%

Low settings: for example 90 fps
Core 1 = 100%
Core 2 = 90%
Ckre 3 = 90%
Ckre 4 = 75%

These loads go up and down all the time so at low settings, you'll see some spikes in the load that causes the cpu to not run fluidly anymore.
It's like a pipeline. If things get stuck, you have a massive hiccup until it's clear again.
 
I think I have the same problem but mine only happens on Shuto, always right after the first parking area. Not every time I pass it, but thats where I am every time it happens. Started with 1.75 and now does it with any patch version.

The slow motion you describe, its like you get a frame every 2 seconds or so?

Doesnt happen frequently enough to bother me tho. Plus I can restart and be back to driving in seconds..
Exactly but im actually getting around 70 or so, according to steam
 
I think I have the same problem but mine only happens on Shuto, always right after the first parking area. Not every time I pass it, but thats where I am every time it happens. Started with 1.75 and now does it with any patch version.

The slow motion you describe, its like you get a frame every 2 seconds or so?

Doesnt happen frequently enough to bother me tho. Plus I can restart and be back to driving in seconds..
so the slow motion doesnt happen anymore, but now when im looking at some directions on shuto, the fps goes lower and theres like a control delay
 
Then it might be sol.
Try to select a standard weather with the default post process filter and check again
I am now certain is SOL, i tried what ou said and it didnt work but then I made a clean reinstall and as soon as I installed SOL it started again. But then, after deleting SOL the problem stays.
im Sharing my render stats with and without sol.
What should I do?
 

Attachments

  • unnamed (2).jpg
    unnamed (2).jpg
    84 KB · Views: 277
  • unnamed (1).jpg
    unnamed (1).jpg
    68.6 KB · Views: 397
I am now certain is SOL, i tried what ou said and it didnt work but then I made a clean reinstall and as soon as I installed SOL it started again. But then, after deleting SOL the problem stays.
im Sharing my render stats with and without sol.
What should I do?
Yeah looks like sol is causing the lower performance :(
No idea what to do... Try an older sol version?
 
Last edited:
This is easily explained but takes a lot of words:

You have a few game cpu threads that take time to be calculated (frame time).
At higher settings, the biggest of these threads takes by far the longest time to be completed for each frame.
You can't split these single threads so what normally happens is that your cpu is hanging in the "single thread limit", which in theory means that one cpu core is at the maximum and since you can't split the load, the other cpu cores can't help that one core.

Windows is shuffling the game threads across all cores all the time though to maximize efficiency. It happens a million times per second so Taskmanager etc will show a nicely spread load across all cores. But if you'd slow down time far enough, you would see one core hitting the maximum, then the next core hitting the maximum etc.

Now if you lower the settings, that one biggest game thread takes less time to be completed and therefore the fps go up.
In relative terms though, the other game threads now cause a higher load.

If Windows wouldn't shuffle the threads around across all cores, it would be like this:

High settings: for example 50 fps
Core 1 = 100%
Core 2 = 50%
Core 3 = 50%
Core 4 = 30%

Low settings: for example 90 fps
Core 1 = 100%
Core 2 = 90%
Ckre 3 = 90%
Ckre 4 = 75%

These loads go up and down all the time so at low settings, you'll see some spikes in the load that causes the cpu to not run fluidly anymore.
It's like a pipeline. If things get stuck, you have a massive hiccup until it's clear again.
Windows Perfmon will show actual thread performance also. You'll see one of them is always higher.
 
Windows Perfmon will show actual thread performance also. You'll see one of them is always higher.
Mhh.. Yes, one will be higher and it shows the "averaged" load for each cpu thread but it's still not showing what's happening at one single cpu cycle.
A cpu can only be at full load (doing something) or at zero load (not doing something). Anything between 0 and 100 percent load is an average.

Process explorer can show the application threads. And while you can have a thread hitting the maximum possible percentage (12.5% for 8 cpu threads), it doesn't tell you if it's restricting the fps.

I tested this with rocket league. I limited the fps to 40 and the application threads were still hitting 12.5%.
But when I disabled the fps limit, I had about 300 fps and still not full graphics card load.

So my statement was only about finding out how many threads an application can use in parellel to then get an idea about the maximum possible overall cpu load (3 application threads with "high" cpu load = 3x 12.5 = 37,5% so something below 50% after windows does its tricks).


What I wanna say: there's sadly no way of actually seeing a cpu limit. Process explorer only helps to understand why 20% cpu load without any core showing high load can still be a cpu limit and perfmon can show if there's a clear cpu limit (one cpu thread maxing out or the overall cpu load maxing out).

The only way to know what to upgrade is by looking at the graphics card load.
 
hmmm ... the FAQ seems to tell that it's NOT possible with Lasso... so I wonder how Hugo managed to do it and what settings helped him fix the issue.
Or if someone else has used Lasso to solve the 99 % cpu issue, or has found another solution,
pls share here !

Extracts from the FAQ of Lasso that make me understand that it isn't possible for Lasso (or any other software) to break a single core task into pieces and devide them on seperate cores to speed things up.

1647861452391.png


1647861486487.png
 
You can't force multithreading!
It needs to be coded. And it's very complicated. Try to imagine how to calculate the graphics before the physics or to calculate the chassis flex before the tyre hits the kerb.
It starts with user input, car movement and air+ground inputs to the physics chain.
Then the physics are done and then you can display where the car actually is.
More or less like that at least...

With a big developer team it's possible to be clever and split certain things but in the end it also needs to gain more by using more cores than the coordination overhead causes additional load.

Windows is pretty good at shuffling all the different processes around on all cores to maximize performance.
And by default all applications can use as many threads as they want.

Assetto Corsa simply doesn't have more than 2-3 big threads.

Only solution to get rid of the 99% warning is to get more cores or to limit your fps below the cpu bottleneck.
 
Only solution to get rid of the 99% warning is to get more cores or to limit your fps below the cpu bottleneck.
What do you think my issue is here? My 8700k is running at a stable 5.1ghz, 32gb 3000mhz, 2080ti. I limit my frames to 60 (for testing) in LAC. Still get that 99% thing off and on. When its off, everything is good. Then its like someone flips a switch. I get the 99% message and everyone in the server starts flickering side to side. Then 99% is off and everyone looks normal. It seems the "on/off" happens at anywhere from 3-10 minute intervals.

Ive also tested my 16c/32t CPU with the same result. What do you make of that?

There has to be some bug that is causing this for some of us. Im sure some ARE limited that get this 99% message, but for some there is a bug of sorts.

For reference when im testing the better CPU, I only swap the MB and CPU. OS and drives stay the same.
 
Last edited:
What do you think my issue is here? My 8700k is running at a stable 5.1ghz, 32gb 3000mhz, 2080ti. I limit my frames to 60 (for testing) in LAC. Still get that 99% thing off and on. When its off, everything is good. Then its like someone flips a switch. I get the 99% message and everyone in the server starts flickering side to side. Then 99% is off and everyone looks normal. It seems the "on/off" happens at anywhere from 3-10 minute intervals.

Ive also tested my 16c/32t CPU with the same result. What do you make of that?

There has to be some bug that is causing this for some of us. Im sure some ARE limited that get this 99% message, but for some there is a bug of sorts.

For reference when im testing the better CPU, I only swap the MB and CPU. OS and drives stay the same.
Can be a LOT of things sadly.
First step, if you're using content manager:
enable developer apps, activate both performance stats apps, take 2 screenshots. Once when things are normal, one when the issue happens.
Maybe we can get some clue about where to look from there.

It could be Windows background processes, bugs in an AC app, cores getting parked by Windows, driver issues (sometimes USB devices can cause massive CPU spikes somehow) etc etc.
So first get data, then we'll see.

What's often suggested:
Go to the official forums and ask there and post all your logs from a session where the issue happened.
 

Latest News

Are you buying car setups?

  • Yes

  • No


Results are only viewable after voting.
Back
Top