Rift-S + 3070 low performance but low charge on CPU and GPU?

Hi guys!

Im struggling to get 80fps on my Rift-S when there is more than 10 IA and I don´t undertand why.

I am on:
Ryzen 5 3600
RTX 3070
RAM Vengeance 32 16Gb @ 3200Mhz
Nox Urano 750W
Gigabyte B550M DS3H

Running windows 10 pro, fresh new install without any other software but assetto corsa, oculus soft, oculus tray tool, MSI Afterburner and Chrome. No office, no antivirus, no trash...
Drivers updated to latest versión for GPU and motherboard.

I´ve been doing some test with odd results for me.

Asseto Corsa + Content Manager + CSP 1.74 + Sol 2.0.2 quality settings quite high.
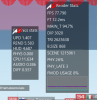
I use Afterburner to monitor CPU and GPU usage and temps. And Oculus Tray Tool to see performance headroom in VR.

On sigle screen at 1080P I get this:

1 car on track with ppfilter sol_extra
250fps to 350 fps
GPU 97% (locking to 60fps GPU goes down to 30%)
CPU 18%


1 car on track no postprocesing
280 fps to 450 fps
GPU 80% to 95%
CPU 15% to 40%

So it looks my PC it´s performing fine, from my point of view.

But when I go VR and put some cars I get this:

1 car on track with ppfilter sol_extra
80 fps
GPU 50%
CPU 10%
headroom performance 25-30%

11 cars on track with ppfilter sol_extra
80fps
GPU 65%
CPU 20%
headroom performance -3% to -20% (still 80fps but with some drops)

Without postprocesing the values are better, not much, but better. About -5 to +17% of headroom performance and GPU 40% and CPU 17% usage.

The odd thing for me is, how can a get so low headroom performance when I put some IA cars but according to afterburer GPU and CPU usage are low?

Temperatures are ok 65 to 72ºC for CPU and 60-65ºC for GPU.

If I raise the amount of cars to 13 or 15 I didnt get 80fps, the ASW kicks in and headroom performance goes -30%.
And GPU during ASW goes to 30-40%, I supose this is normal because there is only 45 frames rendering.
But the hole thing is driving me crazy, how can I get so low performance headroom with such a low charge on GPU and CPU? Where is the problem?

Thank you so much!
 
You should use AC's ingame cpu usage measurements, FRAME_TIME and MAIN_THREAD (shown as FT and MAIN_T on the Render Stats app), it'll tell you more accurately how single thread performance is limited. car-car collision cpu load goes up a lot with AI and is single threaded.

If you're limited by frame time then I think you can end up in a situation where you end up in 45 fps asw even though neither CPU or GPU is 100% loaded, because it has to run through both to draw each frame (first cpu calculates new object positions, then gpu draws them)
 
Last edited:
To check if your cpu is performing fine:
Please download Cinebench R15, go to "File" (top left) -> Preferences -> select custom number and type in "3".

1615987677083.png


Before we start with settings and what not, let's simulate the CPU load of AC and check if your score is in the same range as other 3600.

The result should be between 570-610. If it's only scoring 520 for example, we'll have to look into your CPU setup, not into the game or Oculus setup.

About CPU load: Read my post here. You'll also find my "optimized" settings.

The theoretical calculation would be:
Ryzen 3600 = 6c/12t so 100%/12 = 8.33% per core maximum load.
AC using 2 big cpu threads, one smaller and a bunch of very small threads => About 30% maximum load possible.

In general: If your graphics card isn't at 95% or above, you are CPU limited or you have an fps limiter somewhere.
You can't see CPU limits though!

As Stereo said though: Main_T and Frame_T are good indicators for a CPU limit!

Here's how AC looks like when I'm starting a race with 35 AI cars. My fps limit is set to 90. Gsync monitor, not VR though.

I disabled the CPU optimizations in CSP to really push into the CPU limit:
CPU_Limit_AC.jpg


As you can see, the fps are are clearly below 90.
My RTX3070 was at 40% load, my CPU load was below 50% on all cores and overall.
But the MAIN_T was above 90% and I already got some "PHY_LATE" counts.

Here's my CPU load in that moment:
AC_CPU_Limit_Cores.jpg


Your CPU might also be parking cores and/or using the virtual cpu cores instead of first using all real cores.
(it's physical and virtual cpu threads but it's easier to use cores to not confuse it with application threads...).

I had this with my 10600k. Running cinebench with 2 threads and my CPU would park all but 2 cores and run both cinebench threads on the first core... One application thread on the physical core and one on the virtual.
My score was BAD.. like super bad! :rolleyes:

Disabling core parking and cinebench put the load on one thread per core and my score went back to normal.
 

Attachments

  • 1615988712028.png
    1615988712028.png
    55 KB · Views: 209
Last edited:
Additional info about the Render Stats screenshot:
I googled a bit and if I got it right, the CPU value is milliseconds and the overall CPU frame time.
So my CPU took 11.634ms to complete everything and send it to my GPU.
My 3070 apparently took (12.2-11.634 = ) 0.566ms to complete the frame.

Pretty clear CPU limit! (And the reason I'm looking into the 11600k to replace my 10600k).

I also think that the blue line in the graph of the Render Stats app is the CPU frame time. Red line should be GPU time but... It's 0.5ms..

Here's another quick Screenshot from running the game in.. 7k or whatever with nvidia DSR and only 5 AI cars.
GPU_Limit_AC.JPG

You can see that I have only 61 fps now. MAIN_T is pretty low and you see the red line in the graph being visible and way above the blue line.
CPU in the left Graphics stats app now shows 7.358ms.
So probably the 16.2ms FT (Frame Time) are split like that:
7.358ms CPU + 8.842ms GPU = 16.2ms


jfyi, currently the 5600x is the best "bang for the buck" simracing CPU! 6 cores are enough and the single core performance is better than any Intel right now.
With your B550 motherboard, the 5600x should work after a BIOS Update. Maybe a good upgrade at some point this or next year :)
 
You should use AC's ingame cpu usage measurements, FRAME_TIME and MAIN_THREAD (shown as FT and MAIN_T on the Render Stats app), it'll tell you more accurately how single thread performance is limited. car-car collision cpu load goes up a lot with AI and is single threaded.

If you're limited by frame time then I think you can end up in a situation where you end up in 45 fps asw even though neither CPU or GPU is 100% loaded, because it has to run through both to draw each frame (first cpu calculates new object positions, then gpu draws them)
To check if your cpu is performing fine:
Please download Cinebench R15, go to "File" (top left) -> Preferences -> select custom number and type in "3".

View attachment 455695

Before we start with settings and what not, let's simulate the CPU load of AC and check if your score is in the same range as other 3600.

The result should be between 570-610. If it's only scoring 520 for example, we'll have to look into your CPU setup, not into the game or Oculus setup.

About CPU load: Read my post here. You'll also find my "optimized" settings.

The theoretical calculation would be:
Ryzen 3600 = 6c/12t so 100%/12 = 8.33% per core maximum load.
AC using 2 big cpu threads, one smaller and a bunch of very small threads => About 30% maximum load possible.

In general: If your graphics card isn't at 95% or above, you are CPU limited or you have an fps limiter somewhere.
You can't see CPU limits though!

As Stereo said though: Main_T and Frame_T are good indicators for a CPU limit!

Here's how AC looks like when I'm starting a race with 35 AI cars. My fps limit is set to 90. Gsync monitor, not VR though.

I disabled the CPU optimizations in CSP to really push into the CPU limit:
View attachment 455698

As you can see, the fps are are clearly below 90.
My RTX3070 was at 40% load, my CPU load was below 50% on all cores and overall.
But the MAIN_T was above 90% and I already got some "PHY_LATE" counts.

Here's my CPU load in that moment:
View attachment 455699

Your CPU might also be parking cores and/or using the virtual cpu cores instead of first using all real cores.
(it's physical and virtual cpu threads but it's easier to use cores to not confuse it with application threads...).

I had this with my 10600k. Running cinebench with 2 threads and my CPU would park all but 2 cores and run both cinebench threads on the first core... One application thread on the physical core and one on the virtual.
My score was BAD.. like super bad! :rolleyes:

Disabling core parking and cinebench put the load on one thread per core and my score went back to normal.


What a master class guys! I didn´t know about the single core usage of simracing games.

I´ve been doing some fast test with same replays from previous data and I got this:

Single car on track

Single car.jpeg


11 cars ontrack

11 cars grid.jpeg


24 cars on track

24 cars grid.jpeg


My cinebench 15 result is this:

cinebench 15.jpeg


According to this, my cpu barely reach the 570 point on cinebench so its time to look into the CPU setup or could be ok with 562.

A part from this I have a question: From where do you get the 8.842ms GPU value from this sentence?

"CPU in the left Graphics stats app now shows 7.358ms.
So probably the 16.2ms FT (Frame Time) are split like that:
7.358ms CPU + 8.842ms GPU = 16.2ms"

And what do you think about my test guys?

My main problem is than I don´t understand what´s behind the majority of rendar and graphics stats hud. I have to google some I think :coffee:

Thank you so much for your advice!
 
Last edited:
24 cars on track
That looks reasonable. Your CPU time goes above 12.5 ms so the fps drop into asw mode (40).
To maintain 80 fps, you need to keep that CPU value low enough.
Interestingly the "MAIN_T" isn't as high as I would've thought. If that's going close to 100%, you run into general issues like physics errors etc.

Your "REND" = "render" time is pretty high. Do you have any HUD apps enabled?
My cinebench 15 result is this:
According to this, my cpu barely reach the 570 point on cinebench so its time to look into the CPU setup or could be ok with 562.
562 points for 3 threads is "okay" but it is a bit low. I guess you didn't touch the BIOS?
Here are scores from various users I've got data from:
My 10600k OC to 4.9 GHz: 628 points
A 3600 OC'ed (dunno how far): 606 points
5600x no-OC: 743 points

So your score isn't really bad, but it's also not really great.. Simracing in VR is sadly pretty demanding on the single core performance.
You should close Chrome, look into core parking, energy profile and maybe overclocking!

I'd say 580-590 should be achievable with some basic tweaking :)
A part from this I have a question: From where do you get the 8.842ms GPU value from this sentence?

"CPU in the left Graphics stats app now shows 7.358ms.
So probably the 16.2ms FT (Frame Time) are split like that:
7.358ms CPU + 8.842ms GPU = 16.2ms"
I calculated the overall frame time minus the CPU time :p
16.2 - 7.358 = 8.842 :D
And what do you think about my test guys?

My main problem is than I don´t understand what´s behind the majority of rendar and graphics stats hud. I have to google some I think :coffee:
It looks alright. REND seems to be a bit high.
You could get that a bit down by reducing reflection frequency and distance. Enabling all CPU optimizations in CSP and by disabling a few of the fancy extras. You need to play around which is reducing the CPU time.
Your RTX 3070 is powerful enough for all stuff enabled but every Polygon needs to first go through the CPU.

You need to think about like this:
geometry, objects, general details are all increasing CPU load. HUD apps, world details, reflection frequency.
But things like "how fancy the details look" is done by the graphics card.

For some things this is easy.. Like more objects around the track = more things for the CPU to prepare.
But to know if the GrassFX from CSP will be heavy on the CPU (more geometry, the grass objects) or maybe only heavy on the GPU (because it's just a fancy piece of code and no actual object?!), you have to test out!

Your "REND" is a lot higher than mine though, so it's probably down to graphic settings, CSP settings or you're using mod cars or mod tracks that are not optimized?
That's an abnormally small score for the R5 3600
No it's not, read the thread ;)
It's about doing a run with only 3 threads, since Assetto Corsa only really uses 3 threads.

Sadly all the magazines don't run benchmarks with 3 or 4 threads.

For example the AMD 3000 CPUs have a really good single core boost, so 1 thread will look very good and they also have a really good multithread performance.

But from 3-5 threads, most Intel's are a bit better, because their boost isn't dropping as much when using more than 1 core.
 
Last edited:
- UPD = no idea
- REND = rendering thread (both CPU and GPU)
- HUD = the HUD
- PHYS = the physics calculations (0 in replays and when not driving afaik)
- CPU = the frametime of the CPU alone
- AUDIO = the time spent for the audio stuff
- DIFF = no idea, maybe that's the GPU time? (FT minus CPU = DIFF?)

- FPS = well, your FPS :p
- FT = Frame Time (overall, CPU+GPU time)
-MAIN_T = the frame time of the "main assetto thread", when it's going close to 100%, you're getting issues like physics errors!
- DIP, TRI, B.SIZE,SCENE = Geometry/Polygon counts. Cars and Track geometry, a LOT of stuff!! Not really interesting for us...
- PHY = not sure...
- PHY_LATE = as long as it's not counting up quickly, everything is fine. If you get 200+, you have issues
- FMOD USAGE = no idea.. afaik that's linked to the sound, not interesting for us

The graph: red = GPU frametime, blue = CPU frametime.
 
PHY is the percent of a physics frame (3ms) it takes for the cpu to finish calculating physics. The game always runs physics at 3ms per tick no matter what fps you get to make sure it behaves the same for any player, it only slows down graphics related cpu use if you have a low framerate. Obviously in replays physics is not calculated.
PHY_LATE is number of frames that finished calculating after the real time they were supposed to be done... if it's a temporary spike it'll just add 1, it'll be counting up if your game can't run at 100% speed.
 
Last edited:
That looks reasonable. Your CPU time goes above 12.5 ms so the fps drop into asw mode (40).
To maintain 80 fps, you need to keep that CPU value low enough.
Interestingly the "MAIN_T" isn't as high as I would've thought. If that's going close to 100%, you run into general issues like physics errors etc.

Your "REND" = "render" time is pretty high. Do you have any HUD apps enabled?

I always have the tyres app, CSP render stats (to see fps) and sometimes position chart. On VR I like to have a clean view.

562 points for 3 threads is "okay" but it is a bit low. I guess you didn't touch the BIOS?
Here are scores from various users I've got data from:
My 10600k OC to 4.9 GHz: 628 points
A 3600 OC'ed (dunno how far): 606 points
5600x no-OC: 743 points

What do you mean with touch the BIOS? Do some overclocking? I didn´t touched anything neither the bios or system, or drivers. I am on stock cpu fan, so overclock seems not to be a good idea at the moment.

So your score isn't really bad, but it's also not really great.. Simracing in VR is sadly pretty demanding on the single core performance.
You should close Chrome, look into core parking, energy profile and maybe overclocking!

I'd say 580-590 should be achievable with some basic tweaking :)

Why must I close chrome? Is it CPU demanding when open? In the other hand I went to resources monitor and according to this I think there is no parked cores, right?

WhatsApp Image 2021-03-17 at 23.02.11.jpeg


Cheking my energy profile I see I have an AMD Ryzen High Performance profile active, I supone this came from drivers. It should be enaugh I think.

WhatsApp Image 2021-03-17 at 23.06.07.jpeg


Tell me about this basic tweaking please. You mean OC?

I calculated the overall frame time minus the CPU time :p
16.2 - 7.358 = 8.842 :D

It looks alright. REND seems to be a bit high.
You could get that a bit down by reducing reflection frequency and distance. Enabling all CPU optimizations in CSP and by disabling a few of the fancy extras. You need to play around which is reducing the CPU time.
Your RTX 3070 is powerful enough for all stuff enabled but every Polygon needs to first go through the CPU.

I´m gonna try with your settings from the other thread.

You need to think about like this:
geometry, objects, general details are all increasing CPU load. HUD apps, world details, reflection frequency.
But things like "how fancy the details look" is done by the graphics card.

For some things this is easy.. Like more objects around the track = more things for the CPU to prepare.
But to know if the GrassFX from CSP will be heavy on the CPU (more geometry, the grass objects) or maybe only heavy on the GPU (because it's just a fancy piece of code and no actual object?!), you have to test out!

Your "REND" is a lot higher than mine though, so it's probably down to graphic settings, CSP settings or you're using mod cars or mod tracks that are not optimized?

I´m testing on kunos cars and tracks.

So the basic learning from today is keep MAIN_T as low as possible by removing extra work from CPU (detalis, reflexions, etc) and try to raise the CPU power by OC and optimizing system. Right?

One thing I don´t understand is why MAIN_T is lower on 24 cars than on 11 cars, being graphic settings identical in both test :O_o:

Thank you so much!
 
Last edited:
Why must I close chrome? Is it CPU demanding when open? In the other hand I went to resources monitor and according to this I think there is no parked cores, right?
Everything that runs (in the background or not) will use some cpu. It might be only 1 or 2% but when you're struggling for every little bit, you have to close things.
To check the impact of Chrome:
Keep the usual things open that you normally have open while driving.
Do the 3 thread cinebench.

Then close chrome and everything that uses any cpu and is not essential (sort Taskmanager for cpu) and repeat the cinebench.

I'm sure chrome has some impact...
What do you mean with touch the BIOS? Do some overclocking? I didn´t touched anything neither the bios or system, or drivers. I am on stock cpu fan, so overclock seems not to be a good idea at the moment.
Yeah I meant overclocking, memory timings, etc.

The amd stock cooler is okay but not for oc, right.
But: if you only raise the boost for when using up to 3 cores, the cpu will barely get hotter.
Only if you would do a 12 thread cinebench, it would become a problem.

I have my 10600k set to 4.9 GHz on all cores. But I lowered the max watt from 125 to 90w.
When I do a cinebench run with more than 5 threads, my cpu will clock down to 4.0-4.4 ghz and won't get hot :)
always have the tyres app, CSP render stats (to see fps) and sometimes position chart. On VR I like to have a clean view
So there are no fps to get then. Nice! (and not nice, since this would've been easy :p)
Cheking my energy profile I see I have an AMD Ryzen High Performance profile active, I supone this came from drivers. It should be enaugh I think.
Yep, it should put the cpu to boost to the maximum and keep cores from parking!

I see no parking in the performance Screenshot!
So the basic learning from today is keep MAIN_T as low as possible by removing extra work from CPU (detalis, reflexions, etc) and try to raise the CPU power by OC and optimizing system. Right?
Yes. Try my settings, maybe adjust them here and there.
One thing I don´t understand is why MAIN_T is lower on 24 cars than on 11 cars, being graphic settings identical in both test :O_o:
Because your vr headset is limiting the fps to 40 in that Screenshot, which means only half the load is needed.
The cpu time isn't half of what it is with 12 cars though, which is why the fps are dropping below 80.
Normally you would see the main_t going higher and your fps dropping to something like 70.
But with your headset it's 80 or 40, nothing in between.


About optimizing (closing chrome etc) and overclocking:
If you would get 600 points like the one guy from the forums, this would mean:
Your 562 points = 80 fps
His 600 points = (600/562)*80 = 85,4 fps

Not much but a bit of headroom...

And another thing: can you please download cpu-z, open it, go onto the dram/memory tab and take a screen shot?
When you never went into the bios, your ram might not be running with it's profile but instead be running with amd defaults.
You might gain a few fps from that and it's very easy to set!
 
Last edited:
Everything that runs (in the background or not) will use some cpu. It might be only 1 or 2% but when you're struggling for every little bit, you have to close things.
To check the impact of Chrome:
Keep the usual things open that you normally have open while driving.
Do the 3 thread cinebench.

Then close chrome and everything that uses any cpu and is not essential (sort Taskmanager for cpu) and repeat the cinebench.

I'm sure chrome has some impact...

Yeah I meant overclocking, memory timings, etc.

The amd stock cooler is okay but not for oc, right.
But: if you only raise the boost for when using up to 3 cores, the cpu will barely get hotter.
Only if you would do a 12 thread cinebench, it would become a problem.

I have my 10600k set to 4.9 GHz on all cores. But I lowered the max watt from 125 to 90w.
When I do a cinebench run with more than 5 threads, my cpu will clock down to 4.0-4.4 ghz and won't get hot :)

So there are no fps to get then. Nice! (and not nice, since this would've been easy :p)

Yep, it should put the cpu to boost to the maximum and keep cores from parking!

I see no parking in the performance Screenshot!

Yes. Try my settings, maybe adjust them here and there.

Because your vr headset is limiting the fps to 40 in that Screenshot, which means only half the load is needed.
The cpu time isn't half of what it is with 12 cars though, which is why the fps are dropping below 80.
Normally you would see the main_t going higher and your fps dropping to something like 70.
But with your headset it's 80 or 40, nothing in between.


About optimizing (closing chrome etc) and overclocking:
If you would get 600 points like the one guy from the forums, this would mean:
Your 562 points = 80 fps
His 600 points = (600/562)*80 = 85,4 fps

Not much but a bit of headroom...

And another thing: can you please download cpu-z, open it, go onto the dram/memory tab and take a screen shot?
When you never went into the bios, your ram might not be running with it's profile but instead be running with amd defaults.
You might gain a few fps from that and it's very easy to set!

Hi! Here again. I downloaded cpu-z and I´m afraid my ram it´s not working at 3200MHz...

Here are the screenshots:

Spd tab:

cpuz memory.PNG


Slot 2

cpuz slot 2.PNG


Slot 4

cpuz slot 4.PNG


Maybe I have to check my BIOS setup, right?


On the other hand I´ve been doing some online research and I found a software suitable to make OC almost at one click on my Rayzen 5 3600. It look a perfect solution for someone like me whose last OC stuff was on a Pentium II @ 233MHz and was involved a pencil and a magnifier :D

For those interested the software is ClockTuner for Ryzen (I supone I´m not discovering the wheel) and maybe could give me some extra points in cinebench.
My mother board must be AGESA 1.0.0.4 (now 1.0.0.2) but it looks like a matter of update BIOS I think.

It seems there is a similar solution for RAM speed... lets reserch. Told you here my results for those with same problem with FPS than me...
 
On the other hand I´ve been doing some online research and I found a software suitable to make OC almost at one click on my Rayzen 5 3600. It look a perfect solution for someone like me whose last OC stuff was on a Pentium II @ 233MHz and was involved a pencil and a magnifier :D
I'm sadly not familiar with Ryzen OC, so I rather don't say anything wrong. There are superb guides out there though!
Normally the overclocking should be pretty easy with something called "PBO" -> Precision Boost Overdrive.
This, as far as I know, simply tells your CPU "It's okay to go beyond the stock specification limits, as long as you are cool enough".

The CPU then simply boosts as far as it thinks it can do.
Only thing you need to have an eye on is the voltage (especially vcore), that the motherboard will pump into the CPU.

From what I've heard, you enable PBO, do a Cinebench run while monitoring the voltages and then check if they are okay.
If they are, you are done :)

But I sadly don't know which tool is best/most accurate for Ryzen vcore or what the voltages should be...

Look up for "Ryzen 3600 pbo 24/7 oc" and you should find good help!


For those interested the software is ClockTuner for Ryzen (I supone I´m not discovering the wheel) and maybe could give me some extra points in cinebench.
My mother board must be AGESA 1.0.0.4 (now 1.0.0.2) but it looks like a matter of update BIOS I think.
I wouldn't recommend to use tools that overclock from within windows. They work and there are good ones out there but I really prefer to set things in the BIOS so Windows can't screw things up and you don't have another program running in the background, doing stuff at the start-up.

That said, first google hit for Clocktuner for Ryzen is IgorsLap, which is, as far as I'm concerned a very good source and trustworthy. That guy knows what to do! :)
It seems there is a similar solution for RAM speed... lets reserch. Told you here my results for those with same problem with FPS than me...
--------
Maybe I have to check my BIOS setup, right?
So your memory is running at 2x1066 = 2133 (not perfectly, but that's the specification).

It's a rooky error and it's solved with only one change in the BIOS:
I quickly took a Screenshot from the manual for your motherboard. Gigabyte luckily simply calls it XMP like Intel.
It's also called "X-AMP" for MSI, "D.O.C.P." for Asus and apparently E.O.C.P. for some Gigabyte motherboards.

Just select that option and change "Disabled" to the one Profile you should see there.
Your memory has some specs integrated that the motherboard can read and simply puts the ram speeds to what was listed when you bought the ram :)
XMP_GB_B550.JPG
 
I'm sadly not familiar with Ryzen OC, so I rather don't say anything wrong. There are superb guides out there though!
Normally the overclocking should be pretty easy with something called "PBO" -> Precision Boost Overdrive.
This, as far as I know, simply tells your CPU "It's okay to go beyond the stock specification limits, as long as you are cool enough".

The CPU then simply boosts as far as it thinks it can do.
Only thing you need to have an eye on is the voltage (especially vcore), that the motherboard will pump into the CPU.

From what I've heard, you enable PBO, do a Cinebench run while monitoring the voltages and then check if they are okay.
If they are, you are done :)

But I sadly don't know which tool is best/most accurate for Ryzen vcore or what the voltages should be...

Look up for "Ryzen 3600 pbo 24/7 oc" and you should find good help!


I wouldn't recommend to use tools that overclock from within windows. They work and there are good ones out there but I really prefer to set things in the BIOS so Windows can't screw things up and you don't have another program running in the background, doing stuff at the start-up.

That said, first google hit for Clocktuner for Ryzen is IgorsLap, which is, as far as I'm concerned a very good source and trustworthy. That guy knows what to do! :)

So your memory is running at 2x1066 = 2133 (not perfectly, but that's the specification).

It's a rooky error and it's solved with only one change in the BIOS:
I quickly took a Screenshot from the manual for your motherboard. Gigabyte luckily simply calls it XMP like Intel.
It's also called "X-AMP" for MSI, "D.O.C.P." for Asus and apparently E.O.C.P. for some Gigabyte motherboards.

Just select that option and change "Disabled" to the one Profile you should see there.
Your memory has some specs integrated that the motherboard can read and simply puts the ram speeds to what was listed when you bought the ram :)
View attachment 456148

Well, first step done.

cpuz memory 3200.PNG


I´ll keep serearching on the web to learn everything on how to do some OC on BIOS, first I´m gonna upgrade my bios, there is a very much newer version. Then I´ll do some test on AC and tell you here.

Thank you!
 
Last edited:
To check if your cpu is performing fine:
Please download Cinebench R15, go to "File" (top left) -> Preferences -> select custom number and type in "3".

View attachment 455695

Before we start with settings and what not, let's simulate the CPU load of AC and check if your score is in the same range as other 3600.

The result should be between 570-610. If it's only scoring 520 for example, we'll have to look into your CPU setup, not into the game or Oculus setup.

About CPU load: Read my post here. You'll also find my "optimized" settings.

The theoretical calculation would be:
Ryzen 3600 = 6c/12t so 100%/12 = 8.33% per core maximum load.
AC using 2 big cpu threads, one smaller and a bunch of very small threads => About 30% maximum load possible.

In general: If your graphics card isn't at 95% or above, you are CPU limited or you have an fps limiter somewhere.
You can't see CPU limits though!

As Stereo said though: Main_T and Frame_T are good indicators for a CPU limit!

Here's how AC looks like when I'm starting a race with 35 AI cars. My fps limit is set to 90. Gsync monitor, not VR though.

I disabled the CPU optimizations in CSP to really push into the CPU limit:
View attachment 455698

As you can see, the fps are are clearly below 90.
My RTX3070 was at 40% load, my CPU load was below 50% on all cores and overall.
But the MAIN_T was above 90% and I already got some "PHY_LATE" counts.

Here's my CPU load in that moment:
View attachment 455699

Your CPU might also be parking cores and/or using the virtual cpu cores instead of first using all real cores.
(it's physical and virtual cpu threads but it's easier to use cores to not confuse it with application threads...).

I had this with my 10600k. Running cinebench with 2 threads and my CPU would park all but 2 cores and run both cinebench threads on the first core... One application thread on the physical core and one on the virtual.
My score was BAD.. like super bad! :rolleyes:

Disabling core parking and cinebench put the load on one thread per core and my score went back to normal.
Hi Mate,

I'm struggling with getting a decent cinebench score. Currently around the 470ish mark with just the 3 cores working away. Do you have any suggestions? I did disable core parking which did seem to make a difference initially and i got up to about 530, but I'm back down at the 460 mark again now for some reason.

XMP 2 profile is enabled.... AMD Ryzen High Peformance Power plan is also enabled. Temps are low. Any pointers would be very much appreciated to get my CPU into the ball park you say it should be in.

many many thanks :)
Mhh, download hwinfo64, install it and run it with "sensors only" in the little launcher.
Then a massive amount of data will be shown and you should find you cpu clockspeeds.
Do another cinebench run and look at the clockspeeds. They should be close to what amd says to be the boost clock (with multiple cores, all cores will be a bit lower but maybe you're a LOT below that?)

Apart from that I don't really have a clue apart from:
Open Taskmanager, click on "show more" or "details" or whatever it is in your language at the bottom of the Taskmanager window and then sort the processes by "CPU" to see what's causing cpu load (apart from cinebench and probably the "desktop manager").
Maybe something is running in the background?
I will give this a go cheers.

A little something ive just noticed.... If I run cinebench on 3 cores it doesn't seem to hit 100% utilisation on any of the cores, where as if I run it on all 12, all 12 cores hit 100% utilisation for the whole duration of the test. This doesn't seem right, should I not see 3 at 100%?
 

Latest News

Are you buying car setups?

  • Yes

  • No


Results are only viewable after voting.
Back
Top